Global Economic Outlook Into 2012 And Beyond
Table Of Contents I Introduction II New York Stock Exchange Chart A New York Stock Exchange Chart -- Great Wealth B The Planets' Wealth & Expected Dasa Results D Comparison -- Dasa Descriptions To Actual Stock Prices E The 1998-2017 Saturn Dasa To Date F Balance Of the 1998-2017 Saturn Dasa III United States Chart A Another Chart Of Great Wealth B Maha Dasa Results D Current Mars Dasa E Mars Dasa Through Its Bhutkis IV Conclusions
I Introduction In Vedic Astrology is naturally about charts, for these yield specific information. This analysis interprets the New York Stock Exchange (NYSE) and the U.S. charts. The former symbolizes stock prices and the latter the overall economic welfare of the nation. We're fortunate to have tested and reliable charts for both charts. You may have other birth data for these, but those alternatives are not considered. There is solid historical information on the very early founding of the U.S. investment system -- the May 17, 1792 New York Stock Exchange. Wikepedia explains, The origin of the NYSE can be traced to May 17, 1792, when the Buttonwood Agreement was signed by 24 stockbrokers outside of 68 Wall Street in New York under a buttonwood tree. The birth time has been rectified. Too, in mundane astrology, reliability increases with the age of the chart. This makes sense because the oldest (first) chart represents the initial symbolic foundation for an an organization or nation. Just as the oldest olive tree grew from a seed and bears the best fruit, later grafting from a branch does not grow an identical tree, nor the fruit it yields. These two charts are basic to the global future, for the U.S. remains the dominating economy -- as we've most recently witnessed in the economic contraction that began in the U.S. and then spread quickly over the globe. Another factor, of course, is globalization, linking all economies. Globalization thereby decreases the U.S.'s importance. Yet, globalization also brings offshore financial interests to the U.S. On balance, then, the the U.S. via these two charts remain definitive in global economic forecasting. Stocks prices represents collective investment and borrowing judgments by businesses, investors, banks, other financial institutions and governments at all levels. While there is some look-ahead to the future, stock prices are the most reliable economic yardstick and are reliably documented historically. Thereby, the below the Federal Reserve Bank of St. Louis' historical stock price index graph is used for the analysis of both the NYSE and U.S. charts.
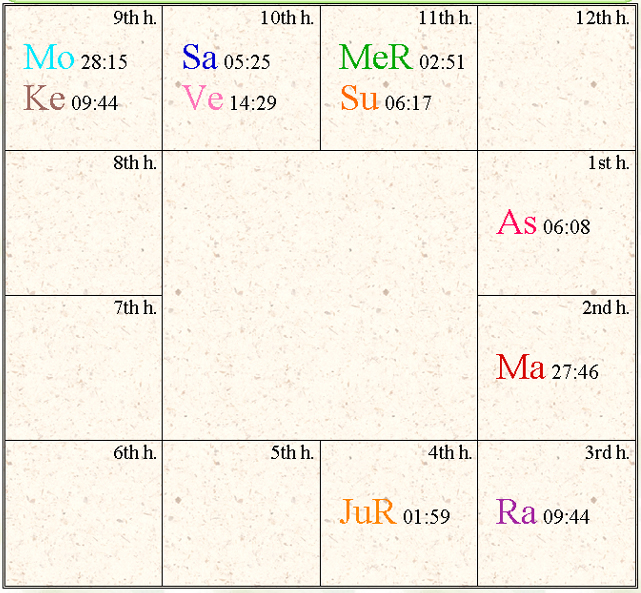
II NYSE Chart A NYSE Chart -- Great Wealth To begin, we first consider whether the New York Stock Exchange (NYSE) chart represents the United States' great wealth, and notably the tremendous run-up in stock prices since the end of World War II. First, look at the trine (wealth houses) rulers. 1st house ruler Moon is placed in the ninth house of wealth. Mars is the raja yoga karaka planet for this chart in ruling the 5th of investments and the 10th of career, and it is very strongly placed in the 2nd of income. 9th house ruler is Jupiter, placed powerfully in the 4th house, a kendra. The Sun is another wealth planet in ruling the 2nd of income and being placed in the 11th. Mercury is also in the 11th with the Sun, a classic combination for business success in this house of gains. The Moon's Nodes, Rahu and Ketu, are also well placed, for they do well in signs ruled by the mental planets, Mercury and Jupiter. This dispositions clearly show the required wealth to validate this chart. There are some flies in the rich ointment, but no chart can be perfect, and certainly the U.S. economy has had many booms and busts. The following planets explain that volatility. Mercury is harmful in ruling the 3rd of desires and the 12th of loss -- impulse brings loss. Venus in ruling the 4th and the 11th isn't favorable either, although it is a wealth indicator for being placed in the 10th. Saturn is a very tough planet for this chart in ruling the 7th and 8th and being fallen in the 10th. Its natural significations of negation and loss are so amplified by these harms that Saturn must bring disasters. Too, and this is interesting, Saturn in the 10th house Raises people up for a time only to bring them down, indicating Saturn can initially signal stock gains but then lowers the hammer, hard. Richard Nixon had a 10th house Saturn. It is valuable to also consider the Upachayas houses, for here is the reason the stock prices have increased so dramatically since World War II. The quality of these growing houses, getting better over time, means they have improved results considerably since the birth of the New York Stock Exchange in 1792 -- now 217 years old. Too, while Upachayas are house 3, 6, 10 and 11, the last two are the strongest and thereby give the greatest improvements. As shown, this chart has Venus and Saturn in the 10th and the Sun and Mercury in the 11th -- the four planets which are least favorable for wealth greatly benefited from their Upachayas placement. Finally note there are no planets in the Dusthana houses -- 6, 8 and 12. Any such placements would reduce wealth. Summary: This chart is indeed one of great wealth but volatility, with stock prices rising tremendously in the last 60 years. It well symbolizes the U.S. with its dominance since World War II over the global economy.
B The Planets' Wealth & Expected Dasa Results To determine how the Dasas impact stock price changes, we consider which planets bring gains and which bring losses, as well as modifying qualities. (This planetary sequence was chosen to match the stock price graph shown in the following section.) 1. Venus is a mixed influence. It does well in the 10th and benefits greatly from Jupiter's aspect. But Venus is harmed by ruling difficult houses and conjunct a very dark Saturn. Like Saturn, Venus benefits from the improving nature of the Upachayas house. Venus: gains, major losses. Dasas: 1801-21, 1921-41 2. The Sun is a gains producer in this chart for ruling the 2nd of income and being placed in the 11th of gains. The Sun capability to bring gains gains is tainted being an enemy to Saturn, particularly during Saturn Dasa, which is ongoing now -- from 1998 to 2017. Being conjoined Mercury supports the business side of investing, but Mercury's bad rulerships stimulate poor decisions. Also, because Mercury is the mind and the Sun the self, the mind is tied to the ego, resulting objectivity loss and failing to listen to others. Sun: gains, erratic. Dasas 1821-27, 1941-47 3. The Moon is obviously wealthy, bringing gains, but Ketu's influence makes it overly emotional, and an aspect from Mars stimulates fearful sensitivity. Moon: great gains, some volatility. Dasas: 1827-37, 1947-57 4. Mars, by virtue of its rulerships and excellent placement also brings gains. However, Mars in the 2nd house of speech is liars (Like G.W. Bush), suggesting that Mars' gains have a dishonest quality that must undermine results. Mars: gains but not all hold. Dasas: 1837-44, 1957-64 5. Rahu is very well placed in the 3rd, especially since Virgo is Mercury's sign. An aspect from the Moon further stimulates tremendous gains, but those are changeable, reflecting the Moon's waxing and waning Too, Rahu is the serpent's head, and his bite stimulates illusion and thereby stock reversals. Another way to understand this is Rahu's endless greed overstimulates prices, which then must fall back. Rahu: great gains, volatile. Dasas: 1844-62, 1964-82 6. Jupiter, the planet of wealth, must bring consistent and solid gains. An aspect from Venus to it's own house of Libra enriches Jupiter's wealth. Another aspect from Saturn to its exalted sign of Libra prevents overindulgence and adds stability but also can bust prices. Jupiter: outstanding gains, vulnerable. Dasas: 1862-78, 1982-98 7. Saturn is a truly destructive planet for this chart, as explained above. Venus helps to some degree, but since the combination of Saturn/Venus is "charming to suit ones purposes" (like Condoleeza Rice), insincerity and manipulation blemish its gains. The saving grace here is the aspect from Jupiter, blunting somewhat Saturn's disasters. Saturn: gains, destroys prices. Dasas: 1878-97, 1998-2017 8. Mercury is a mixed bag in this chart, well placed in the 11th of gains with the Sun but harmful in ruling the 3rd of impulse and the 12th of loss. Yet, the 11th is another Upachayas house -- so like Saturn, Mercury has improved over the long life of this chart. Mercury: gains, very volatile. Dasas: 1897-1914 9. Ketu is well placed in Jupiter's sign in the 9th of wealth with the Moon. However, the Mars aspect must bring instability. (Ketu with Mars signifies "seething anger," which occurred on 9-11.) Too, as Ketu is otherworldly and often called the trickster, he may bring gains just to take them away. Ketu: a seesaw. Dasa: 1914-21
Notice two patterns in the way all the planets, except weird Ketu, behave. First, all planets bring gains. Second, all have downsides. These dovetails with the conclusions above about the New York Stock Exchange chart.
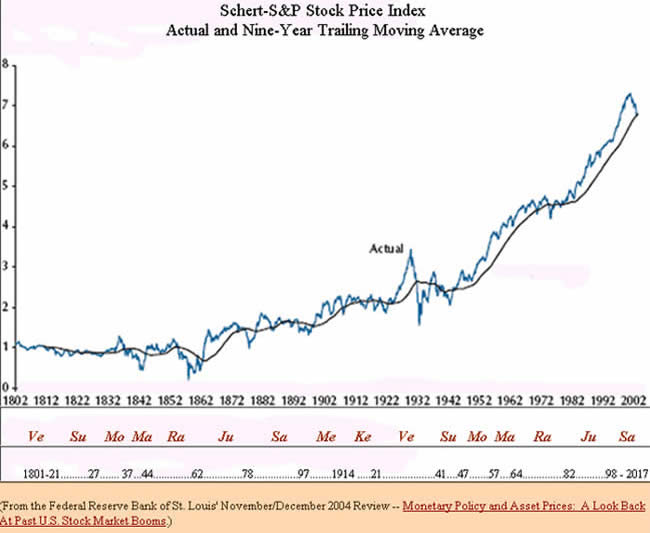
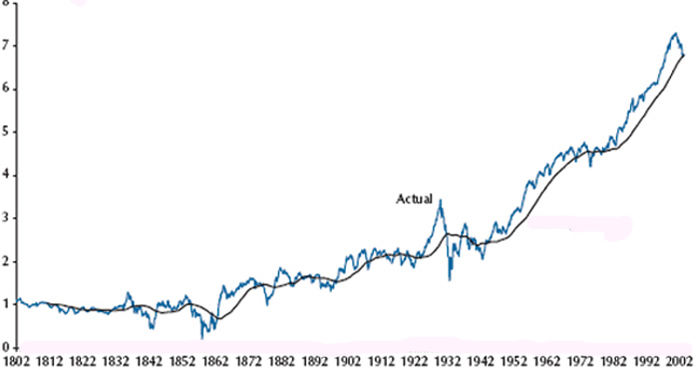
C Matching The Dasas To Actual Stock Prices While the DOW Jones Industrial Average is now considered the benchmark measurement, the DOW wasn't established until 1896. This graph -- from 1802 to 2002 -- is more useful for covering 200 years and also by surveying a full range of public companies -- just as the 1792 New York Stock Exchange chart represents the major publicly traded companies in the U.S. and many from abroad.
(From the Federal Reserve Bank of St. Louis' November/December 2004 Review -- Monetary Policy and Asset Prices: A Look Back At Past U.S. Stock Market Booms.)
This graph matches very well with the conclusions: This chart is indeed one of great wealth with stock prices rising tremendously in the last 60 years. As the Dasas are discussed in the next section, you'll see the strong Upachayas quality of this chart amplifies results over time. That is, stock prices for the second Dasas of each planet better reflect the Dasa descriptions.
D Comparison -- Dasa Descriptions To Actual Stock Prices Venus: gains, major losses Dasas: 1801-21, 1921-41 Stock prices were flat during the 1801-21 Dasa, likely due to the yet low stock trading volumes, or inadequate reporting. The 1921-41 Dasa, however, was the roaring twenties followed by the Great Depression, fitting the description. Sun: gains, erratic Dasas 1821-27, 1941-47 Like Venus, the first Dasa, 1821-27, shows flat stock prices. Also like Venus, the second Dasa, 1941-47, conforms with the description. Notice, though, how stock prices fluctuate dramatically. This, of course, was during the recovery coinciding with World War II and the post war dip. Moon: great gains, some
volatility Dasas: 1827-37, 1947-57 Mars: gains but not all hold Dasas: 1837-44, 1957-64 Stock prices during the 1837-44 Dasa match with a major gain and loss. The second Dasa, 1957-64, has stock price gains but little in those falling back. The description is thereby mostly, but not completely, reliable. Rahu: great gains, volatile Dasas: 1844-62, 1964-82 During the 1844-62 Dasa stock prices were truly volatile, and gains were lost. The 1964-82 Dasa, however, following the description, but note the major stock drops resulting from the Arab oil embargoes in 197-73 and 1980-81. This makes sense, one of Rahu's significations is foreigners. Again, the second Dasa fits better. Jupiter: outstanding gains, vulnerable Dasas: 1862-78, 1982-98 The 1862-78 Dasa, with its gains, and then a major drop at the end, fits the description. The second Dasa, 1982-98, fits even better. Recall the October 19, 1987, when the DOW plummeted 508 points? There was a similar showing of Jupiter's vulnerability October 27, 1997, when the DOW again dropped even more drastically in one day, 554 points. Saturn: gains, destroys prices Dasas: 1878-97, 1998-2017 The 1878-97 Dasa shows stock prices rising and then falling with the 1893-96 Financial Panic of 1893. This graph's ending in 2002 doesn't fully cover the second Dasa, 1998-2017. But, we all know stocks rose during the first several years and have fell 53% since the DOW touched 14,000 in October, 2007. Mercury: gains, very volatile Dasa: 1897-1914 The only Dasa here is 1897-1914, for Mercury's second Dasa is in the future. The stock price graph reveals the description's gains and intense volatility. Ketu: a seesaw Dasa: 1914-21 Again, this is a single Dasa planet, and stock prices during the 1914-21 period match the description.
Summary: The NYSE chart's Dasas effectively and accurately describes U.S. stock price movements. The descriptions of each planet's Maha Dasa are reliable in predicting future stock price movements. Similarly, the Bhutki's should also be accurate. Of course, additional consideration must also naturally be given to how each Bhutki planet relates to Saturn.
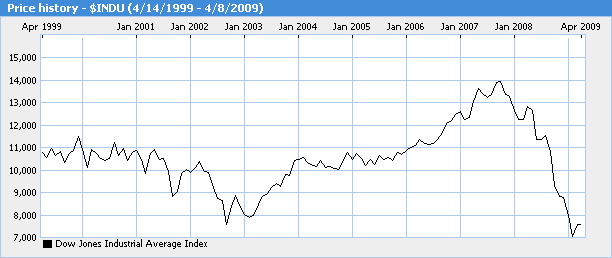
E The 1998-2017 Saturn Dasa To Date As this section of the analysis is about stock prices for the next several years, we can now analyze the 1998-2017 Saturn Dasa through its subcycles. First, note the Saturn Dasa description: gains, destroys prices. That has already occurred the the current 1998-2017 Dasa, as dramatically shown in this second graph -- tracking the popular DOW Jones Industrial Average from 1999 to the present. (From MSN Money)
Following are the Bhutkis, with each planet's description and comparison with actual results, considering first this is Saturn Dasa gains destroys prices 8/01 -- 5/04 Mercury gains, very volatile 9949 to 10,188 +239 5/04 -- 6/05 Ketu a seesaw 10,188 to 10,275 +87 6/05 -- 8/08 Venus gains, major losses 10,275 to 11,543 +1,268 8/08 -- 7/09 Sun (to date) gains, erratic 11,543 to 8,083 -3,460
The results of first 8 1/2 years of Saturn's Dasa are fascinating. 1. Following it's Dasa description, Saturn Dasa brought a huge DOW gain as it moved from 9949 to a 14,000 peak in October 2007 -- and increase of 4051, or 40%. 2. Saturn Dasa then brought it's expected price destruction with a low of 6547 on March 9 of this year -- a drop from its 14,000 high of 7,453, or 53%. Recall the quote about Saturn from section II, Raises people up for a time only to bring them down. Saturn first stimulated a huge stock price run-up and then taught the lesson that this was phantom wealth by taking away that gain and more. 3 The Bhutki planets also operated as described. a. Saturn/Mercury was extremely variable but ended up 239 points. b. Ketu the seesaw ended up 87 points. c. It was during the Saturn/Venus that the DOW tipped over -- from its 14,000 peak in October, 2007. As explained above, Saturn and Venus are the most difficult planets in the N.Y.S.E. chart. Still, as shown, the entire Venus Bhutki yielded a net gain of 1,268 points. d. The Sun Bhutki began last August and so far has brought the DOW down 3,460 points. Yet, the DOW has also been turbulent: starting at 11,543, dropping to a low of 6,547 in early March, and then picking up 1,506 points in the last month to close at 8,053. This extreme volatility follows the Saturn/Sun combination, in which Saturn focuses the Sun's power and then restricts it. This accelorator/braking effect gives a bumpy and sometimes dangerous ride. Unfortunately, the Antardasa planet here doesn't work, for when the market began its rally March 9, the Dasa planets were Saturn/Sun/Saturn (1/28 to 3/24). Antardasas will thereby be disregarded for the balance of this analysis. 5. Considering the entire Saturn 1998-2017 Dasa to date, at its start the DOW was 9949 and has dropped 1866 points to 8,083 -- 19%. Well, this puts the recession in a different light -- not the black of night but the gloom of a rainy day. Stock prices didn't drop a horrifying half, but rather much more manageable one fifth. It was only those who believed their stock values at 14,000 DOW were real who were shocked. The harm is thereby more subjective than objective.
F Balance Of the 1998-2017 Saturn Dasa 8 1/2 years have passed since Saturn Dasa began in mid 1998. It's 19 year Dasa is thereby half over. How should we expect stocks to perform during the remaining 8 1/2 years? What about 2012, when the Mayan calendar ends and other prophecies foretell some kind of Armageddon? Below are the final 4 1/2 Bhutkis: 1. 8/08 -- 7/09 Sun (balance) gains, erratic The Saturn/Sun accelorator/brake effect promises swings through Dasa's end.. 2. 7/09 -- 2/11 Moon (balance) great gains, some volatility Markets should move up during part of this Dasa/Bhutki, but since the Moon is 12 houses away from Saturn, expect losses as well. 3. 2/11 -- 4/12 Mars gains but not all hold Saturn/Mars will be tough because these two planets struggle with each other. Mars will exert its forceful nature to raise up stocks, but Saturn will knock them down again.
4. 4/12 -- 2/15 Rahu great gains, volatile This cycle promises to be very difficult. Rahu's influence brings turbulence, and the serpent's head is at odds with Saturn. Saturn's reality is repelled by this powerful eclipse point with its psychological quality. Also, Rahu sits 6 houses from Saturn, signifying disputes and debts. There will be the hard push ahead this combination brings, but the effort must bring victimizing of some kind. That Rahu is foreigners and Saturn residence abroad suggests global stresses on the U.S. economy will drive the markets down sharply.
5. 2/15 -- 8/17 Jupiter outstanding gains, vulnerable After the Saturn/Rahu new DOW low, the Jupiter Bhutki will see markets recovering.
III The U.S. Chart
A Another Chart Of Great Wealth
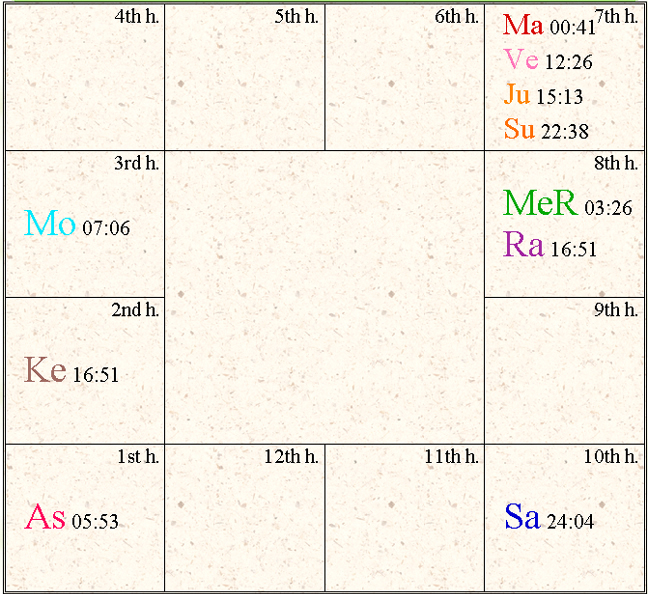
This quality is especially important in the U.S. dealing with its repeated booms and busts. Great wealth is built.. Then, a terrible bust comes that would tear apart any other nation. But the country shakes off the failure and pulls together to harnessing its wealth to regain prosperity. Other nations and culture must believe America is endlessly excessive and crazy for this, but Americans just revel in the great opportunities and believe they can always recoup. The nation's busts arise from 6 planetary dispositions. 1. In Venus' ruling the 6th of debts and the 11th of goals, there's a strong karma for acquiring debt. As a natural benefic conjoined trine rulers, it also stimulates economic growth. But its 7th house placement brings many intrigues and thereby setbacks as well. 2. By Mars ruling the 5th of investments and the 12th of loss, debt-ridden investments bring loss. That Mars is Sandhi exaggerates the harm. Its 7th house position breaks relationship, stimulating fundamental economic changes, notably spending. Mars being conjoined Venus makes both debt and vehicles risk areas. 3. Saturn's ruling the 2nd and 3rd gives a manipulative impulse toward wealth, and being in the 10th, this is America's great career. (Note: Rupert Murdoch is also Sagittarius rising with a strong Saturn, and he is famously manipulative in acquiring companies that don't want to be sold to anyone, much less to him!) Yet, as with the NYSE chart's 10th house Saturn, it Raises people up for a time only to bring them down . The remainder of Saturn's behavior arises fromtMars and Saturn aspecting each other -- giving struggle and criminal activities in financial dealings. There's scheming ingenuity here for Saturn ruling the 3rd of creativity and investments 5th ruler Mars being conjunct creative but debt ridden Venus. (Sandhi Mars is not a virtuous 5th ruler.) America has has a long history of crooked investors -- snake oil salesmen, underwater Florida lots, and most recently, of course, the greatest Ponzi Schemer of all, Bernie Madoff. 4. The all-important Moon rules the 8th of hidden power/disasters and is placed 8 houses away in the 3rd house of desires. An aspect from Jupiter stimulates both wealth and desire. The net effect is an intoxication with power and gluttony. Related is toxic Rahu and mutable Mercury placed in the 8th, bringing a mystical paranoia with cults permeating society. Saturn/Mars manipulators in business and government prey upon beliefs in Armageddon and fears of attacks by foreigners, enabling them grab power and wealth. Isn't this exactly what happened during the second 10 year Moon Dasa, just completed last November 30, 2009 -- a Second Gilded Age? Too, is it any surprise G.W. Bush has a 3rd house Moon with Jupiter? It was this congruence with the U.S. chart that won Bush both elections. 5. 7th and 10th house ruler Mercury is in the 8th with Rahu. This results in the 7th house stellium wealth planets sitting on an earthquake-prone house ruler and a similarly vulnerable 10th house of career ruler. When Venus builds excessive debts, Saturn/Mars creates criminal investment schemes and the Moon's gluttony operates -- it all comes crashing down. Yet, Mercury is excellent for research and inventions in the 8th, and it casts a good aspect to the 2nd house of income and knowledge/education. 6. Ketu is the final harmful influence upon the economy. 2nd house domestic harmony and income are both harmed.
B Maha Dasa Results The stock price index graph from above is applied again. As explained above, stocks mirror the economy, and repeating the data simplifies. At the end of each planet's section, the Dasa is described in relation to overall economic impacts.
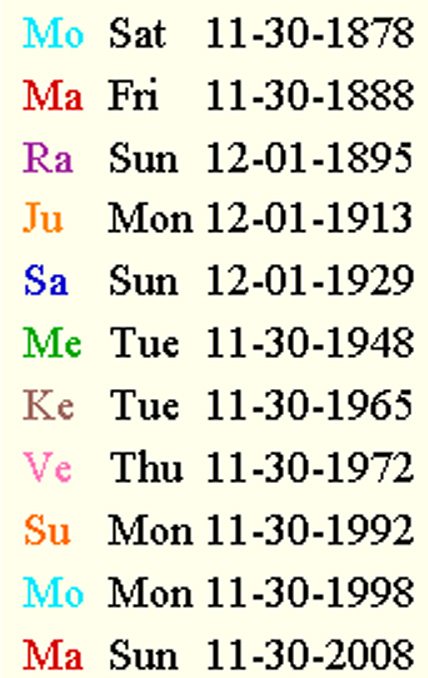
2. As described, Mars rules the 5th and 12th -- investments results in loss. It's first Dasa from 1888 to 1895 brought the Financial Panic of 1893, a four year depression, the worst so far in America's history. The collapse began with over expanded railroads, 600 banks went under, and real estate collapsed. The excesses of the Gilded Age had become its undoing. Labor protests mounted. We're now in the beginning of Mars' second Dasa -- November 30, 2008 to December 1, 2015. (Note: This combination of violent protest and economic hardship paved the way for the Progressive Era's reforms during the next Rahu cycle.) Mars: contracts 3. The nation was born under the first Rahu Dasa 1775 -- 1793 -- fear of, and rebellion against, overbearing authority. The second Rahu Dasa ran from 1896 to 1913, ushering in the first Progressive Era. Progressivism revitalized democracy by redressing Gilded Age excesses and political corruption. This was basically class warfare, similar to the first Rahu cycle's revolutionary's fight against the English colonial class system. The Progressive Movement increased federal power and ended Laissez Faire's absence of regulation. It first took hold under Teddy Roosevelt's first presidency beginning in 1901. Roosevelt began enforcing the Sherman anti-trust act for its true purpose, earning him the nickname, Trust-buster. Roosevelt also pushed through legislation requiring pure food and drugs, railroad rate regulations and the conservation of natural resources. Rahu: expands, volatile 4. Jupiter's 16 year Dasa ran from 1913-29. There was natural variability during World War I, but also the tremendous expansion of the 1920s. Jupiter: expands 5. Saturn's 19 year Dasa from 1929-48 immediately brought the Great Depression, a result of crooked manipulation. The Great Depression was characterized by massive economic drops followed by brief recoveries. It wasn't until the economic stimulus of World War II that the economy began to improve. Yet, even then, it wasn't a steady climb back up. To the nation's great long term benefit, however, were New Deal infrastructure and social welfare improvements and the industrial build-up during the way, which set the stage for the great post war expansion. Saturn: expands, collapses 6. Mercury's 1948-65 Dasa was tumultuous but saw major economic expansion. Mercury's 8th house inventions and 2nd house income and education were prominent and supported this economic growth. Again building upon Saturn's infrastructure improvements, the economy innovated and grew. From labor-saving kitchen appliances to life-saving medicines, the quality of life was elevated. Television, however, was the most dramatic and lifestyle changing. Median family income more than doubled from 1947 to 1979 to $45,900 (current dollars). This Dasa also saw a tremendous education elevation as family wealth propelled baby-boomers into colleges and universities Yet, again there were economic reversals. The country experienced double-dip recessions in 1957, 1960 and 1969. Too, these were the Cold War years -- 8th house disaster that fortunately didn't result because of the nation's overall good fortune with its Jupiter Ascendant. Mercury: expands, volatile 7. Ketu's Dasa from 1965-72 can be one-word labeled -- Counterculture. Although initiated at the end of the Mercury cycle in 1965 by Vietnam protests, Eastern mysticism and hard rock music, it wasn't until otherworldly Ketu's began its cycle that mass culture began to truly transform. A button-down Father Knows Best America broke away with long hair, jeans, drugs, sex, and of course, rock & roll. Ketu Dasa stimulated conflicts to reintegrate the culture along shared democratic values. This social transformation, however, was economically disruptive. Ketu: contracts 8. Venus' 20 year Dasa 1972-92 brought the expected economic growth with setbacks -- recessions in both 1980-81 and 199-91. Venus: expands, erratic 9. The Sun, like Jupiter, stimulates economic expansion. Its results during its 1992-98 Dasa are even better for being both the 9th ruler and conjunct Jupiter. Sun: expands
C Transits This entire analysis has worked well in comparing the Maha Dasas to stock prices - an admittedly broad-brush approach. But the current economic contraction began toward the end of the Moon Dasa, not the expected Mars Dasa. The September 2008 confidence collapse brought the expected economic contraction early. The reason can be found in uniquely destructive transit. While transits are timing indicators for Dasa significations, exceptionally destructive ones can overcome the Maha Dasa. On August 1, 2008 the Sun was fully eclipsed at 15 1/2 degrees Cancer, just 1 degree shy of toxic birth chart Rahu in the 8th house of calamities. At that time, the Dasas were Moon/Sun/Rahu/Mars, and the transiting planets in 8th house Cancer was a stellium: Sun, Mercury, Moon and Ketu. So, not only was Rahu eclipsed, but four transit planets were impacted, and the Dasas were negative. That's enough confluence to knock down an elephant. This eclipsed the chart for the the next several months, explaining the September confidence collapse, continued economic declines in the fall and finally the major blows this past winter ending March 6. The really interesting part of this eclipse was transit Mercury, the earthquake prone ruler of the 7th and 10th in the 8th When this stricken transit Mercury crossed transit Mars September 9 in the 10th house of career, it signaled the beginning of the September 15 confidence collapse. Mercury then went retrograde September 24, right on Mars, causing further economic harms. Next, last January, when Jupiter collided with Rahu and Mars in Capricorn, the 2nd house of income in the U.S .chart, Mercury repeated its destructive dance there. The American public went into shock, businesses suffered and the stock markets cratored In summary, the solar eclipse transit followed by a tough Mercury transit combined to begin the current economic contraction early last fall. Then, with the eclipse effect continuing, another destructive Mercury transit this winter knocked the economy down further. That Mars Dasa began toward the end of 2008 gave another kick to the economy. Many other upcoming upcoming ones will also influence the economy, but those will tend to give transit-typical event timings within the Dasa/Bhutkis. Further transit analysis through the Mars Dasa is very time consuming and thereby beyond the scope of this analysis.
D The 2008-2015 Mars Dasa The U.S. entered its 7 year Mars Dasa November 30, 2008. Although the economy had already taken heavy hits, Mars Dasa quickly hammered excesses of the Second Gilded Age. The Financial Panic of 1893 is the mode here for the current recession in repeating Mars Dasa. Recall that Sandhi Mars being with Venus puts a focus upon debts and vehicles. That nineteenth century bust resulted from railroads over expanding -- debts couldn't be repaid. It makes sense, then, that this current economic contraction began with bad debts and has hit autos the hardest. Real estate too was harmed in in the previous Mars Dasa, for Mars is landed property. During that first Mars Dasa, people walked away from their Victorian mansions, which then fell into disrepair and brought the idea of the Victorian haunted house. Will we have haunted McMansions soon?
E Mars Dasa Through Its Bhutkis Below are expected stocks prices movements through the Bhutkis. 1. 11/08 -- 4/09 Mars contracts This is consistent with results, though there was early stock recovery beginning March 9. 2. 4/09 -- 5/10 Rahu expands, volatile Expect returning confidence to continue. But in Mars Dasa, Rahu Bhutki is dangerous, and Rahu's illusion and volatility in this chart will bring major swings up and down. 3. 5/10 -- 4/11 Jupiter expands This can be a very productive interval, and certainly Jupiter will recoup some end of Rahu Bhutki losses. 4. 4/11 -- 5/12 Saturn expands, collapses Mars/Saturn will be a challenging period. Expect further destruction in industry and finance -- the weak companies that government bailouts simply can't save. 5. 5/12 -- 5/13 Mercury expands, volatile Mars/Mercury promises to be a roller coaster as the economy continues to transform itself -- the old and outdated replaced by new efficient and energy conserving business. 6. 5/13 -- 10/13 Ketu contracts Public protests will dominate, forcing further economic transformation that harms the economy. 7. 10/13 -- 12/14 Venus expands, erratic Clearing out the final Gilded Age debt is expected. This will bring both economic relief and loss. 8. Sun 12/14 -- 5/15 expands Although Mars/Sun is fighting, this interval can signal a return to stable economic growth. 9. Moon 5/15 -- 12/15 expands, variable Gains are expected, but Mars/Moon can be self-serving (Like Bill Gates).
IV Conclusions While this analysis for global economic trends has been streamlined by considering the two primary American charts and their Dasa/Bhutkis, integrating this information is still not simple. One observation can be made which is revealing in a very general way. The NYSE and U.S. charts are running Saturn and Mars Dasas respectively. Although these are not connected directly, the forces of their planetary karmas combine to influence the economy. Chakrapani has observed about Saturn/Mars combinations, Things which are difficult to change can be changed. It is because of this planetary combination that... countries can make radical changes which would otherwise take ages. These changes ultimately bring progress. That the U.S. and the entire globe is experiencing a radical transformation is clear, and while considerable suffering is inevitable, the world will ultimately become more sustainable and genuinely prosperous. Combining the Dasa/Bhutki effects in the two charts, we can make the following judgments. 1. To the spring of 2010 will be a roller coaster of major economic swings that will end on the downside. 2. The next 12 months to the spring of 2011 will show improvement, recouping some previous losses. 3. From the spring of 2011 to 2012 will bring another economic contraction. 4. From spring 2012 to 2013 will be another difficult 12 months. 5. The next 12 months to spring 2014 continues the economic slide with much popular discontent. 6. From spring 2014 to 2015, expect global struggles but the economy stabilizing. 7. The final 12 months considered here, beginning in the spring of 2015, the economy will have fully transformed and sustainable economic growth will resume.
|
||||||||||||||||

